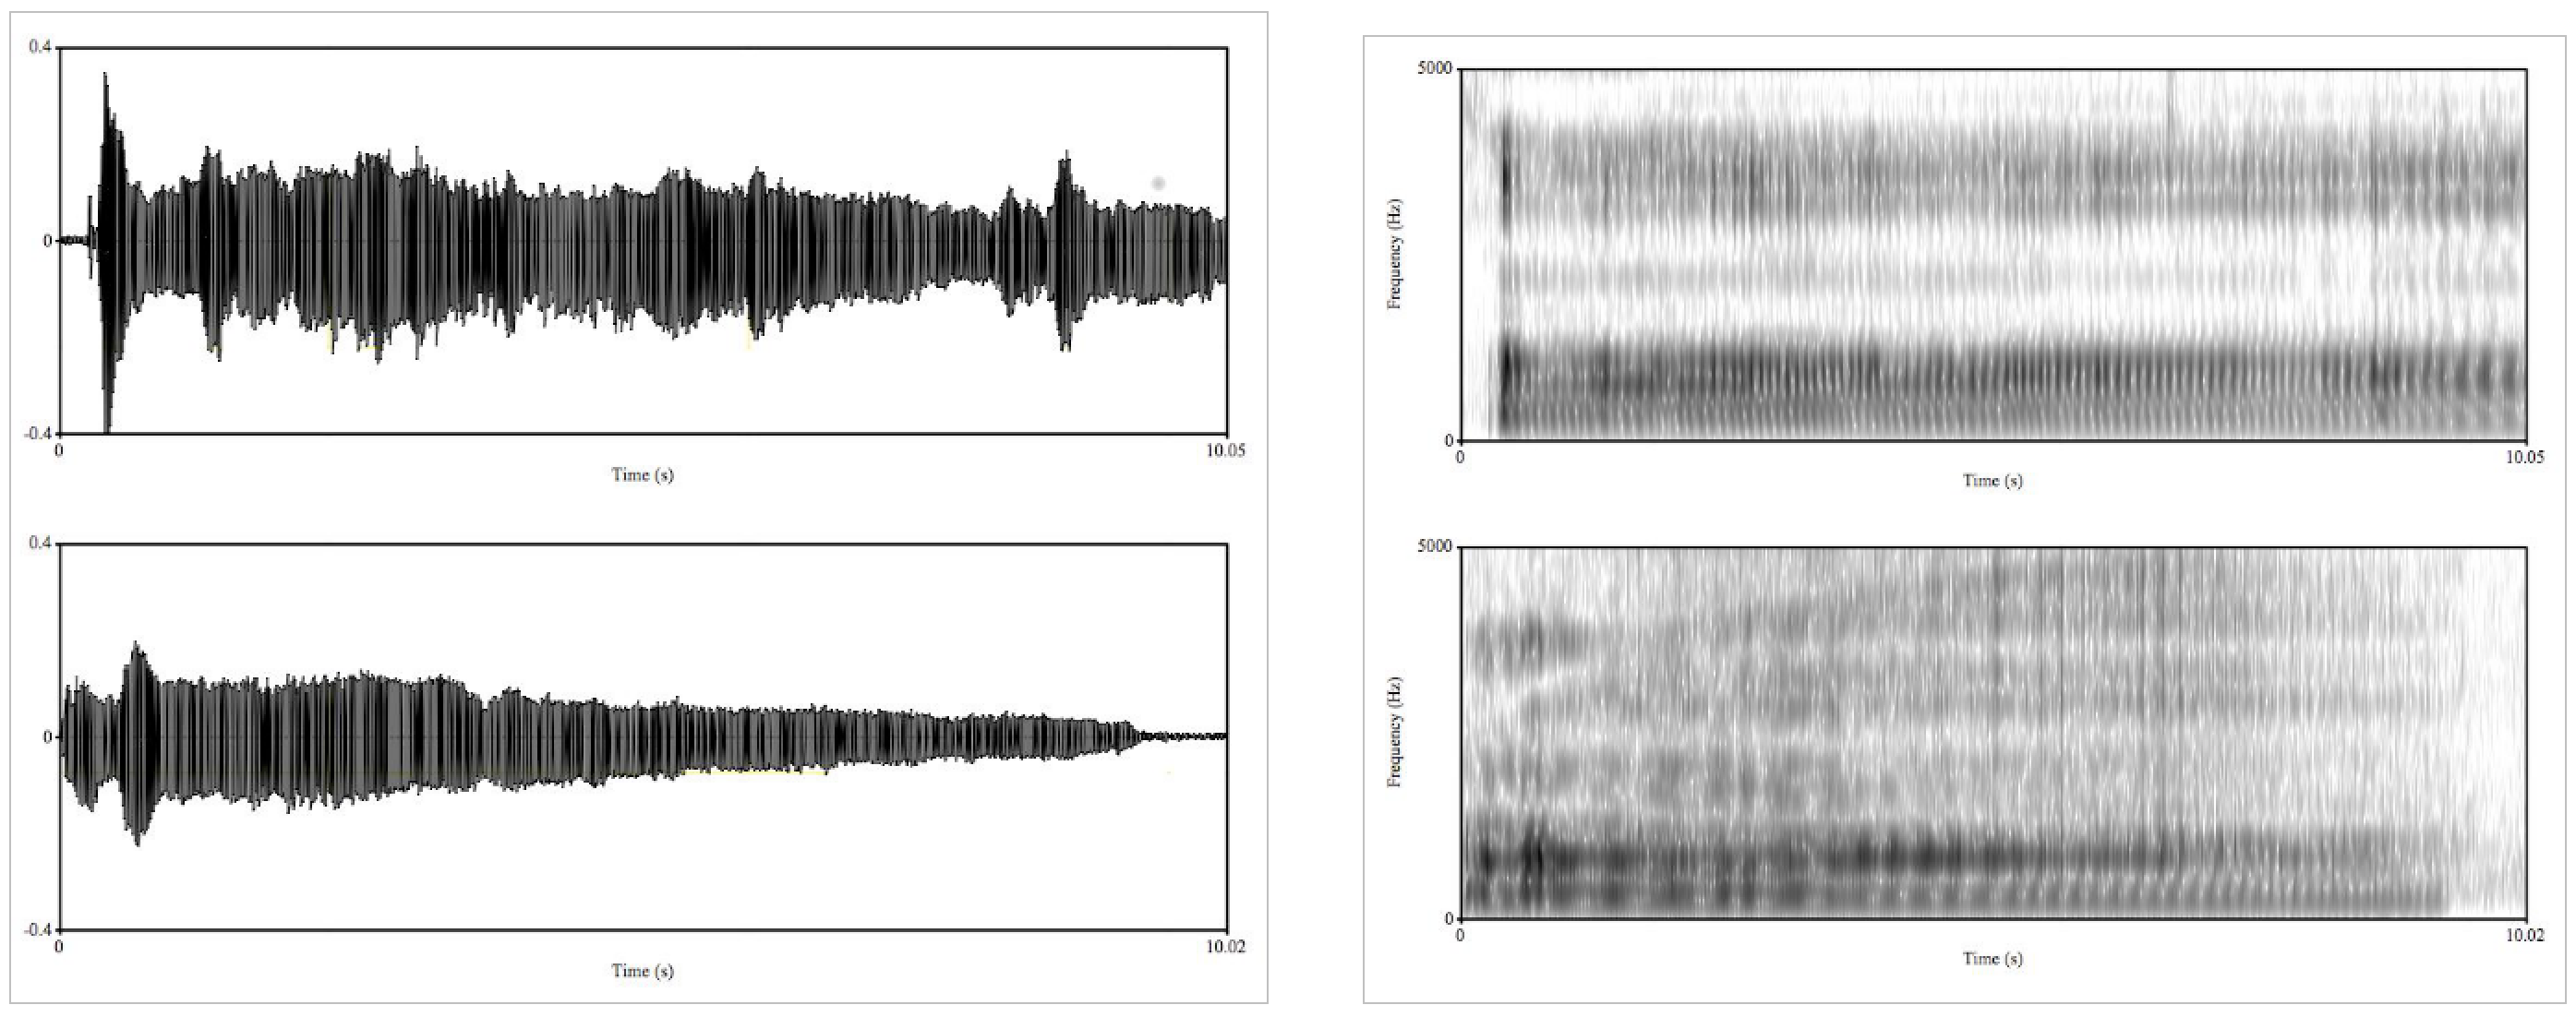
Example mPower patient voice data.
In the mPower app, PD patients are prompted to perform the voice activity three times per day: once before taking their medication, a second time when they feel they are at their best after taking their medication, and a third “random” time. This figure shows example voice data for a single patient on medication (top) and at a “random” time, very likely off medication (bottom). On the left are waveforms, showing the acoustic voice signal over time (0-10 seconds), from which one can clearly see that the patient’s voice trailed off to a minimum (bottom left) compared to after medication (top left). On the right are spectrograms, representing signal amplitude at different frequencies (0-5 kHz) over time (0-10 seconds). The spectrogram after medication (top right) has more uniform frequency bands across the recording compared to the rather “muddled” spectrogram recorded at the random time (bottom right).