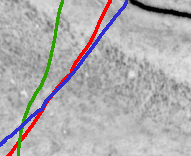
Example boundary estimates in the BigBrain hippocampus.
This figure shows example color line drawings atop a (low-resolution) image tile containing a small portion of the BigBrain’s right hippocampus. The lines represent a novice’s estimates of the CA1/subiculum cytoarchitectonic boundary. This boundary is extremely difficult, as it results in the greatest overall disagreement among hippocampal subfield labeling protocols (