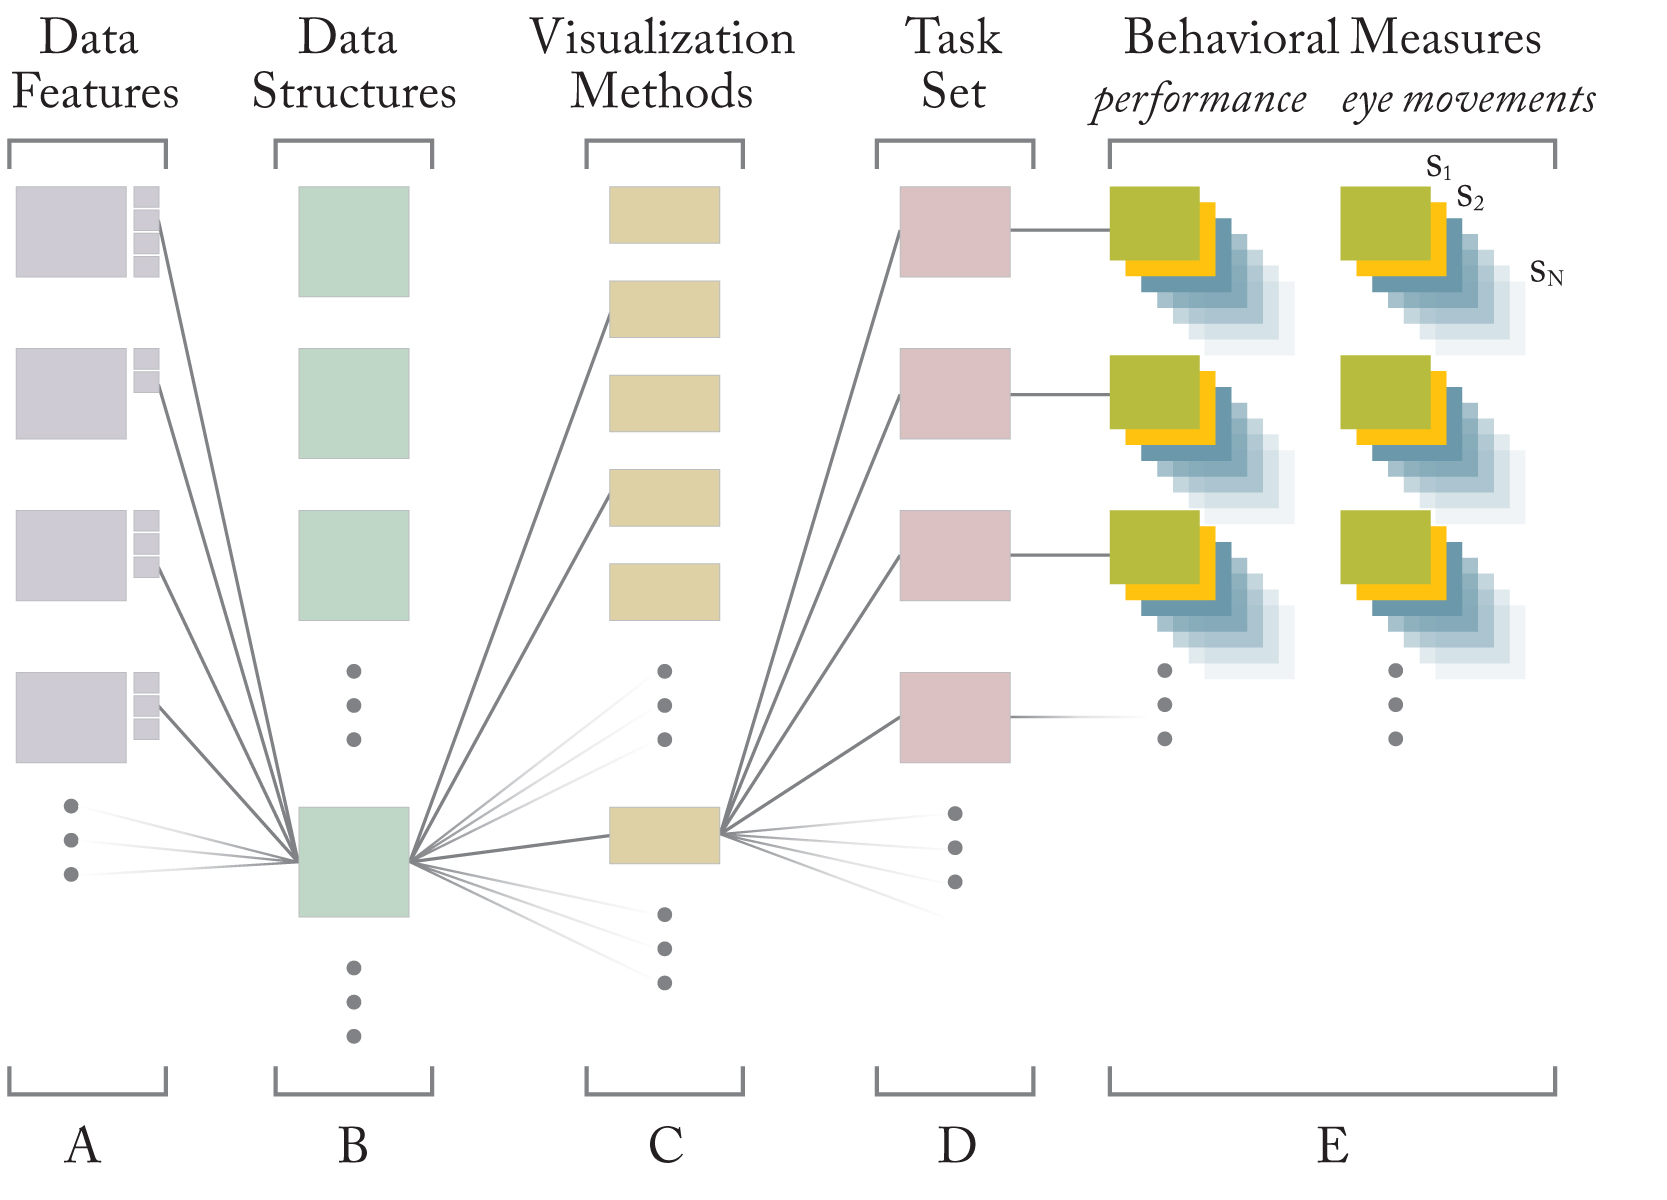
Methods pipeline
(A) Each data feature (scale, dimensionality, etc., defined by the data taxonomy), has attributes (e.g., scale may be set to nominal, ordinal, or ratio). The combination of attribute settings form (B) a data structure, which in turn is amenable to certain (C) visualization methods (defined by the visual taxonomy). When a visualization method is used to perform (D) a set of tasks, (E) performance and eye movement data are recorded for each of N subjects.