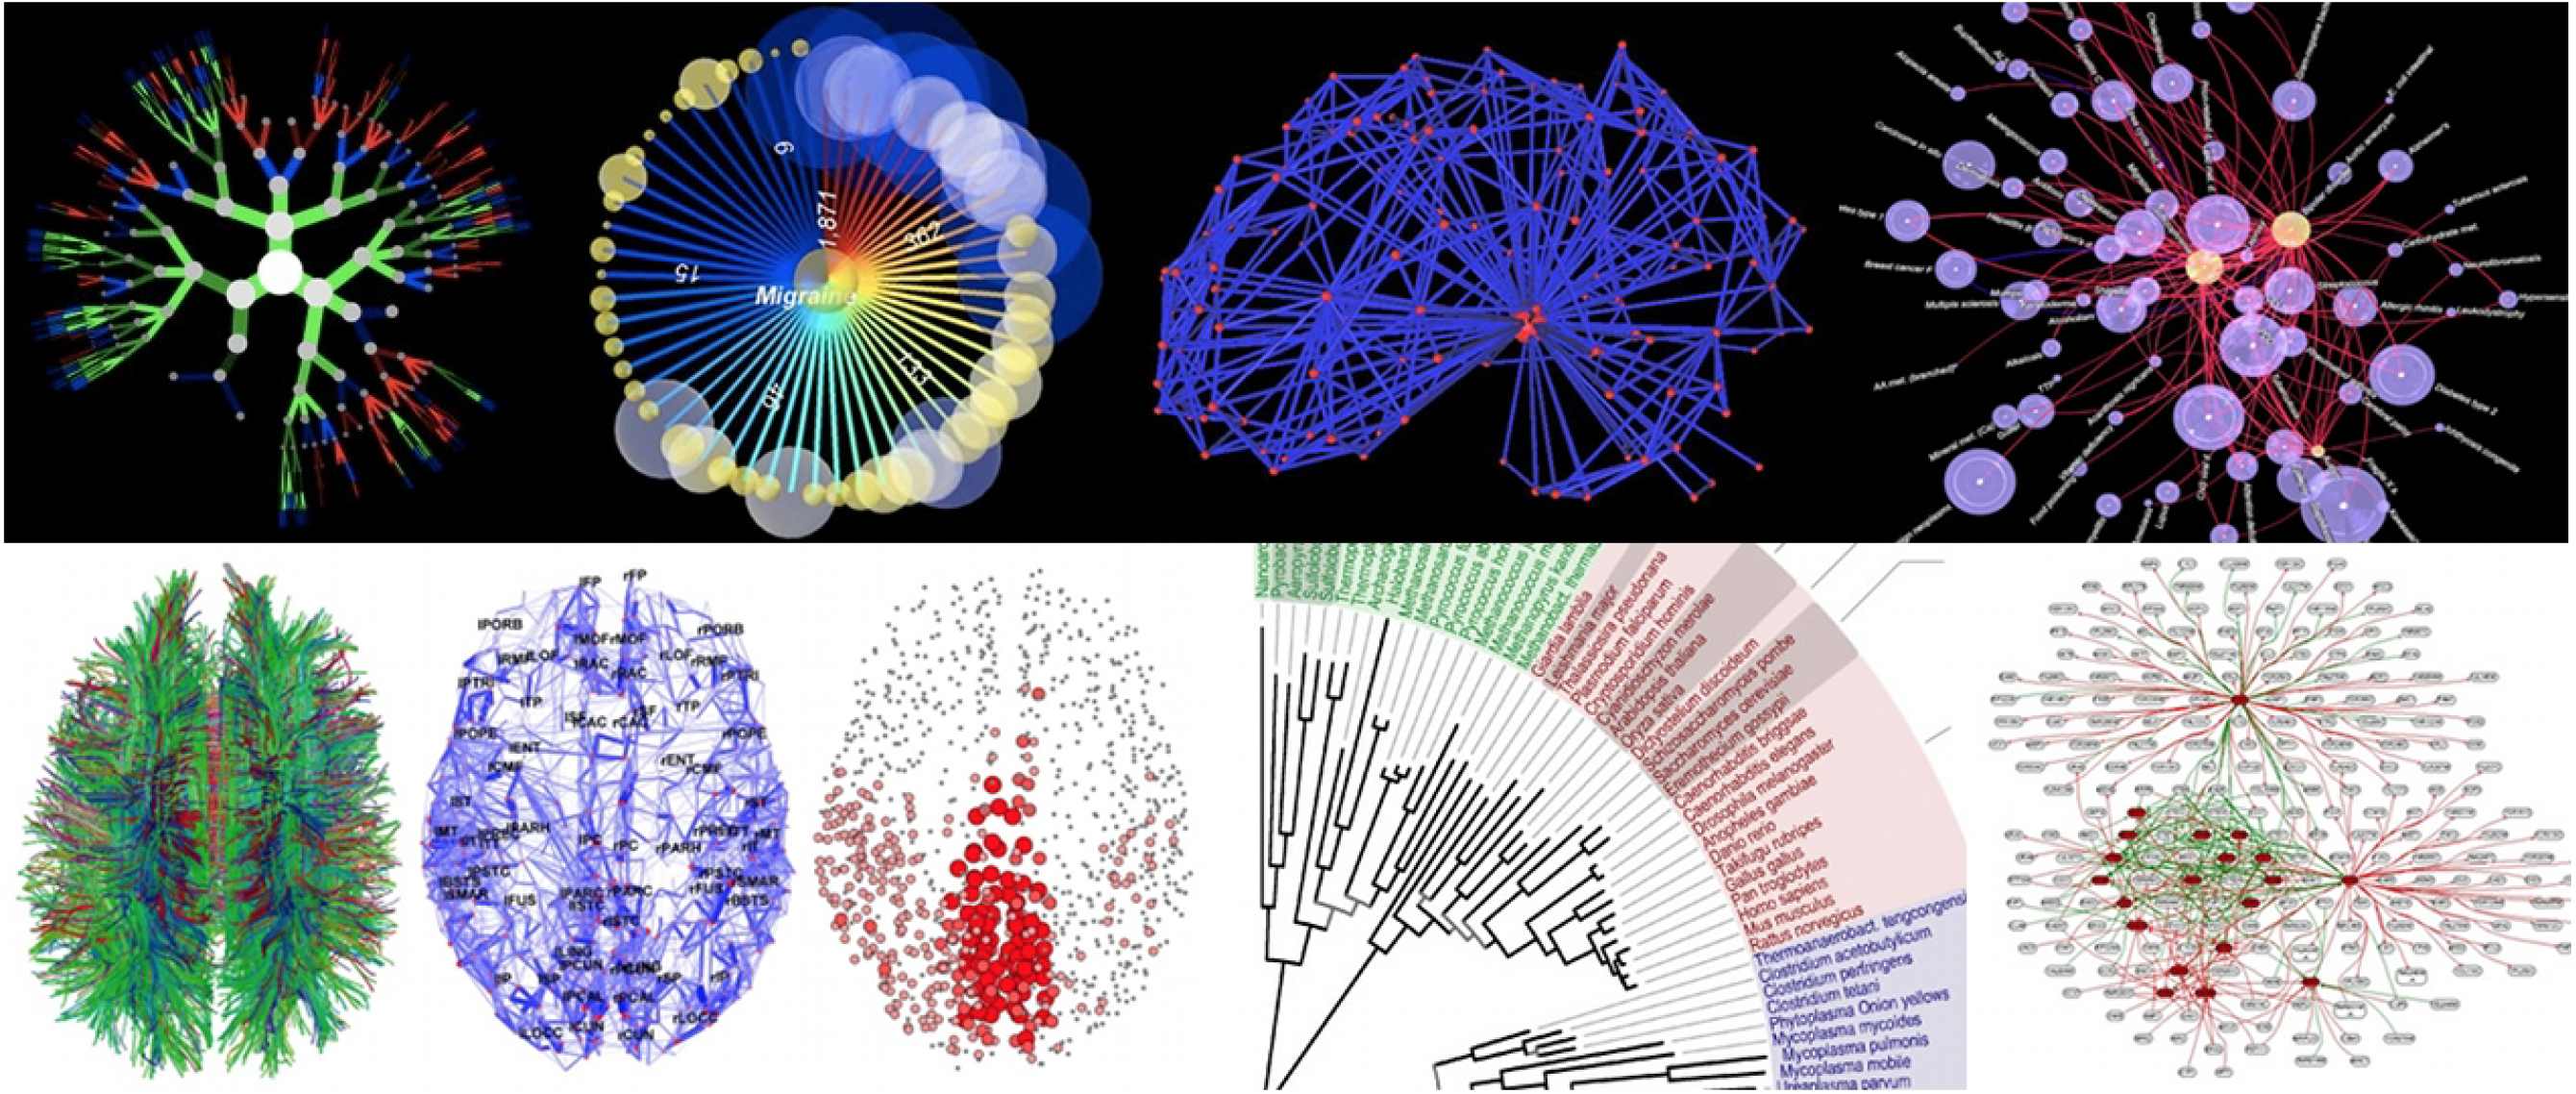
Examples of graph-based representations of scientific data among hundreds on the www.visualcomplexity.com website (categories on the site include biology, food webs and semantic, social, and knowledge networks). Lower left images of DTI, connectome, and network hubs are from Olaf Sporns (2010, Scholarpedia, 5(2):5584).