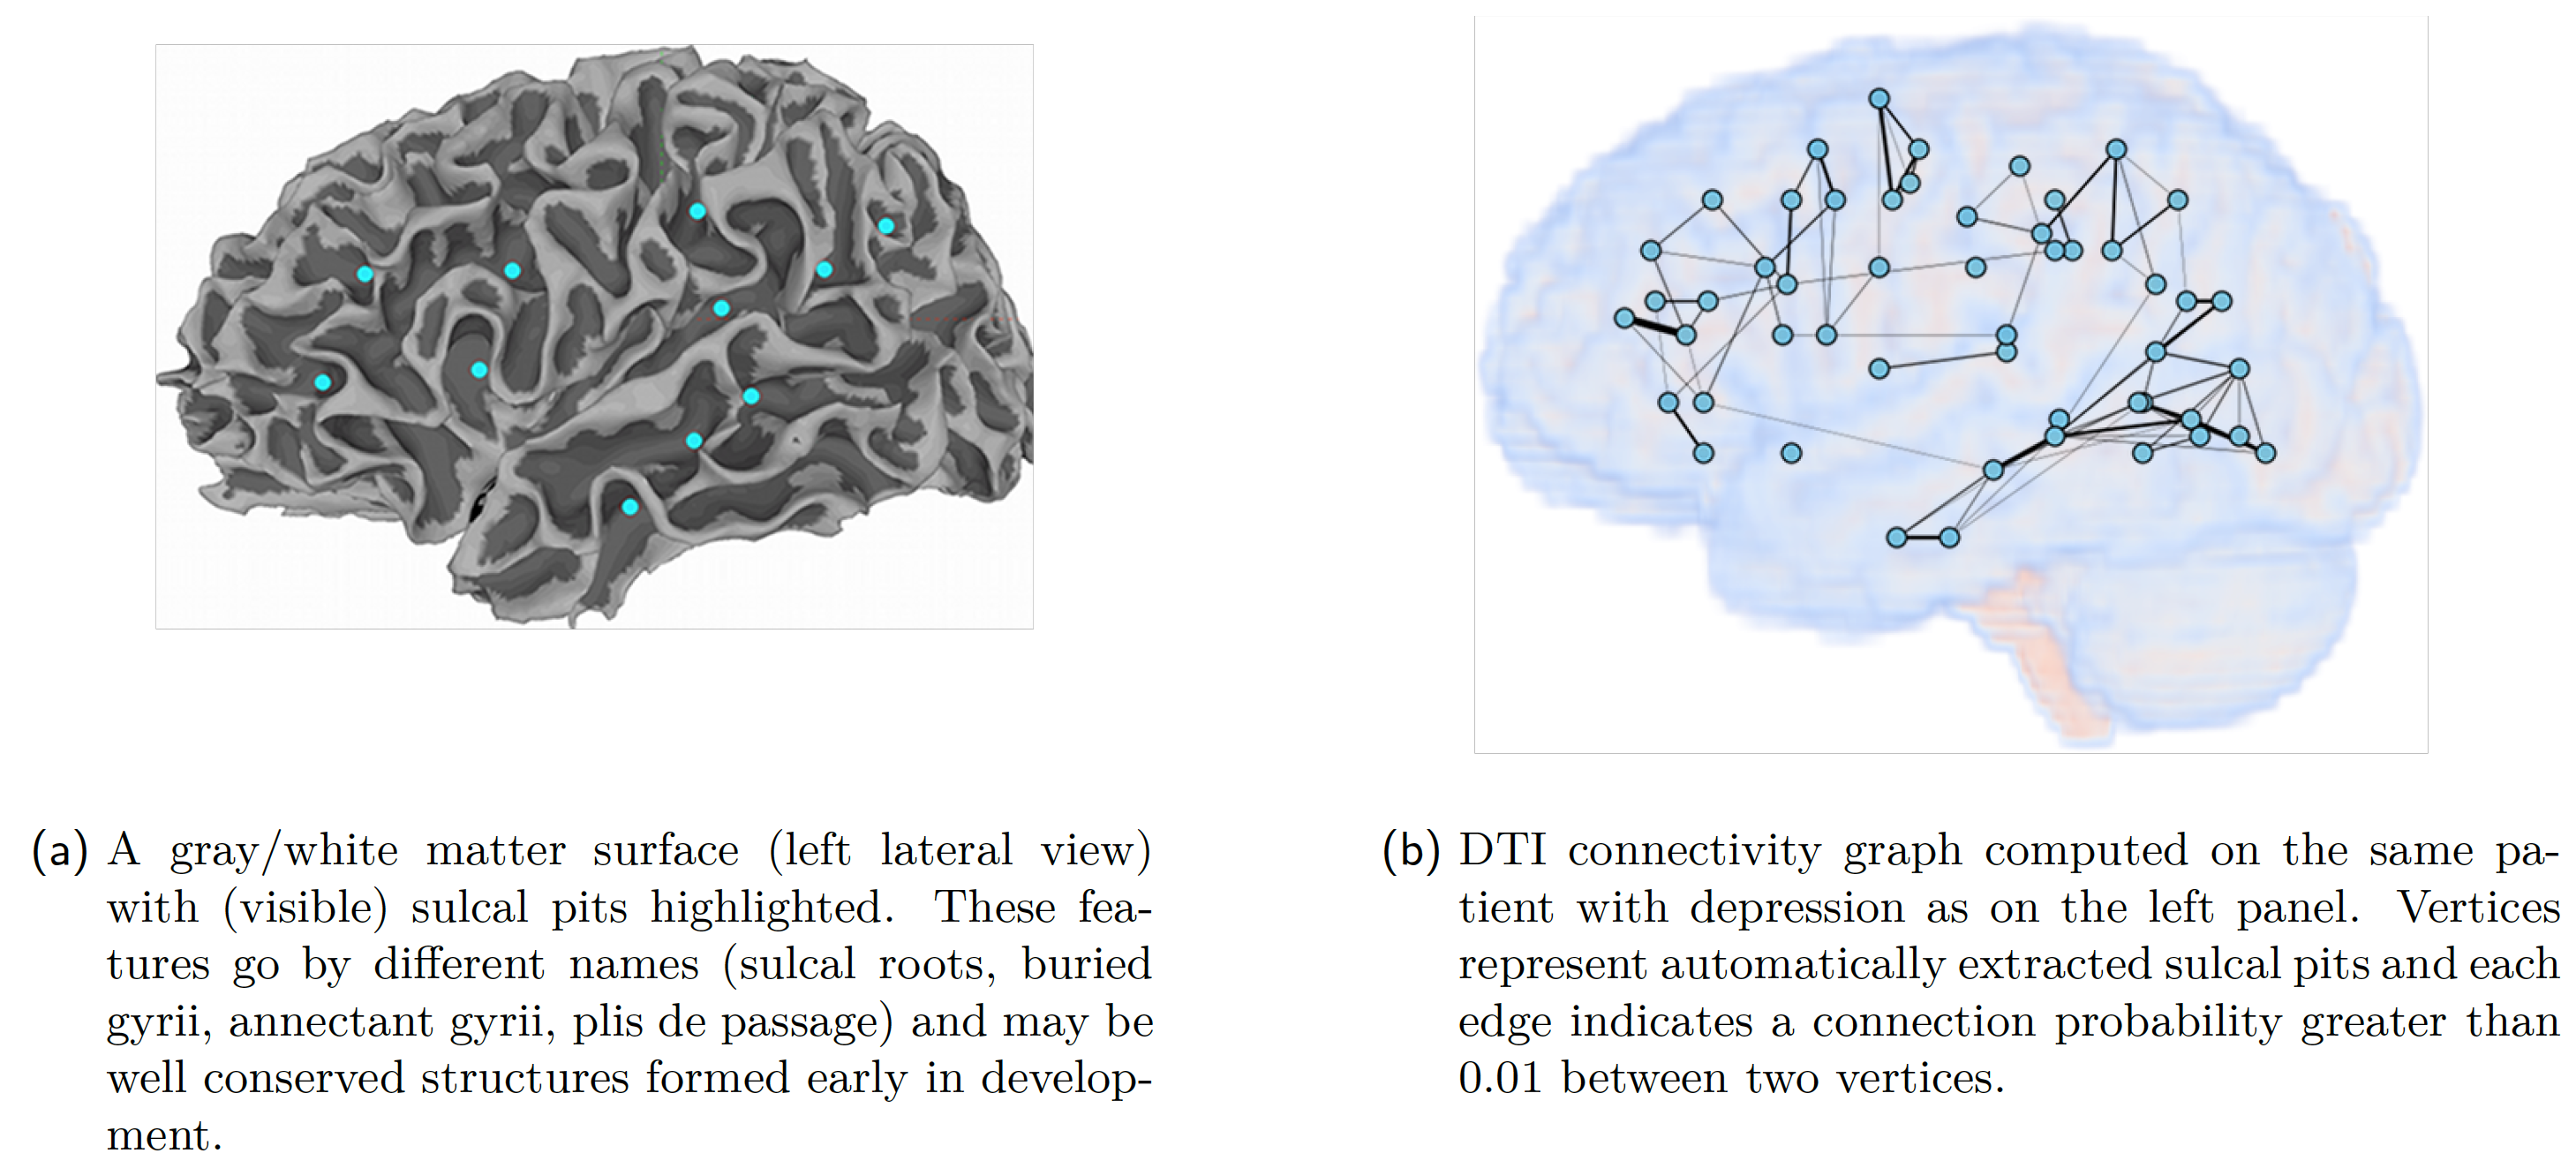
Example of a graph-based representation of MRI and DTI features
(a) A gray/white matter surface (left lateral view) with (visible) sulcal pits highlighted. These features go by different names (sulcal roots, buried gyrii, annectant gyrii, plis de passage) and may be well conserved structures formed early in development.
(b) DTI connectivity graph computed on the same patient with depression as on the left panel. Vertices represent automatically extracted sulcal pits and each edge indicates a connection probability greater than 0.01 between two vertices.